Introduction
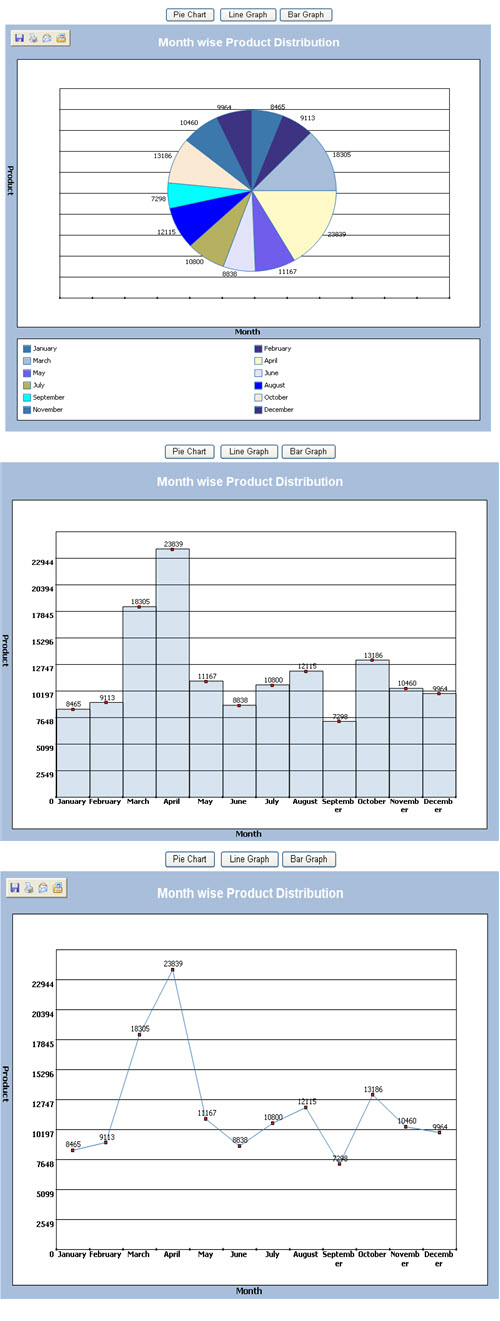
In this tip, I would like to show you how to create a Line, Bar, and Pie chart for your ASP.NET application.
Background
I assume you have basic knowledge of ASP.NET and C#.NET, and so on. Recently I discovered a free .NET charting tool from Microsoft employee Carlos Aguilar Mares
called WebChart. This tip provides a quick overview of WebChart, demonstrating how to use it in an ASP.NET Web application.
This .dll file provides various types of charts such as LineChart, PieChart, BarChart,
etc. To prepare for a chart using this DLL file, follow the steps given below.
How to Configure
Step 1
Start a new web-site; give the name as WebChartGraph.Net. It will give you one
Default.aspx and .cs file.
Step 2
Download source code and copy the Webchart.dll file from the bin directory to some location. Now add a reference to this
WebChart.dll file.
Step 3
Now register this DLL in your Page directory such as shown below. And get the Chart control from this DLL.
<%@ Register TagPrefix="Web" Namespace="WebChart" Assembly="WebChart" %>
Using the Code
Load Initial Data
DataTable dt = new DataTable("Chart");
private void LoadGraphData()
{
DataColumn dc = new DataColumn("Month", typeof(string ));
DataColumn dc1 = new DataColumn("Qnty", typeof(int ));
dt.Columns.Add(dc);
dt.Columns.Add(dc1);
DataRow dr1 = dt.NewRow();
dr1[0] = "January";
dr1[1] = 8465;
dt.Rows.Add(dr1);
DataRow dr2 = dt.NewRow();
dr2[0] = "February";
dr2[1] = 9113;
dt.Rows.Add(dr2);
DataRow dr3 = dt.NewRow();
dr3[0] = "March";
dr3[1] = 18305;
dt.Rows.Add(dr3);
DataRow dr4 = dt.NewRow();
dr4[0] = "April";
dr4[1] = 23839;
dt.Rows.Add(dr4);
DataRow dr5 = dt.NewRow();
dr5[0] = "May";
dr5[1] = 11167;
dt.Rows.Add(dr5);
DataRow dr6 = dt.NewRow();
dr6[0] = "June";
dr6[1] = 8838;
dt.Rows.Add(dr6);
DataRow dr7 = dt.NewRow();
dr7[0] = "July";
dr7[1] = 10800;
dt.Rows.Add(dr7);
DataRow dr8 = dt.NewRow();
dr8[0] = "August";
dr8[1] = 12115;
dt.Rows.Add(dr8);
DataRow dr9 = dt.NewRow();
dr9[0] = "September";
dr9[1] = 7298;
dt.Rows.Add(dr9);
DataRow dr10 = dt.NewRow();
dr10[0] = "October";
dr10[1] = 13186;
dt.Rows.Add(dr10);
DataRow dr11 = dt.NewRow();
dr11[0] = "November";
dr11[1] = 10460;
dt.Rows.Add(dr11);
DataRow dr12 = dt.NewRow();
dr12[0] = "December";
dr12[1] = 9964;
dt.Rows.Add(dr12);
}
Default Visual Configuration
private void ConfigureColors()
{
    ChartControl1.Legend.Position = LegendPosition.Bottom;
    ChartControl1.Legend.Width = 80;
    ChartControl1.YAxisFont.ForeColor = Color.Black;
    ChartControl1.XAxisFont.ForeColor = Color.Black;
    ChartControl1.ChartTitle.Text = "Month wise Product Distribution";
    ChartControl1.ChartTitle.ForeColor = Color.White;
    ChartControl1.XTitle.Text = "Month";
    ChartControl1.YTitle.Text = "Product";
}
Generate Pie Graph
protected void btnPie_Click(object sender, EventArgs e)
{
PieChart chart = new PieChart();
chart.Fill.Color = Color.FromArgb(50, Color.SteelBlue);
chart.Line.Color = Color.SteelBlue;
chart.Line.Width = 1;
chart.ShowLineMarkers = true;
chart.DataLabels.Visible = true;
X = "Month";
Y = "Patient No.";
chart.DataXValueField = X;
chart.DataYValueField = Y;
foreach (DataRow dr2 in dt.Rows)
{
chart.Data.Add(new ChartPoint(dr2["Month"].ToString(),
(int)System.Convert.ToSingle(dr2["Qnty"])));
}
chart.ShowLegend = true;
ConfigureColors();
ChartControl1.Charts.Clear();
ChartControl1.Charts.Add(chart);
ChartControl1.HasChartLegend = true;
ChartControl1.Legend.Width = 140;
ChartControl1.RedrawChart();
}
Generate Bar Graph
protected void btnBar_Click(object sender, EventArgs e)
{
ColumnChart chart = new ColumnChart();
chart.Fill.Color = Color.FromArgb(50, Color.SteelBlue);
chart.Line.Color = Color.Black;
chart.Line.Width = 1;
chart.ShowLineMarkers = true;
chart.DataLabels.Visible = true;
X = "Month";
Y = "Patient No.";
chart.DataXValueField = X;
chart.DataYValueField = Y;
foreach (DataRow dr2 in dt.Rows)
{
chart.Data.Add(new ChartPoint(dr2["Month"].ToString(),
(int)System.Convert.ToSingle(dr2["Qnty"])));
}
ConfigureColors();
ChartControl1.Charts.Clear();
ChartControl1.Charts.Add(chart);
ChartControl1.HasChartLegend = true;
chart.ShowLegend = false;
ChartControl1.RedrawChart();
}
Generate Line Graph
protected void btnLine_Click(object sender, EventArgs e)
{
try
{
LineChart chart = new LineChart();
chart.Fill.Color = Color.FromArgb(50, Color.SteelBlue);
chart.Line.Color = Color.SteelBlue;
chart.Line.Width = 1;
chart.ShowLineMarkers = true;
chart.DataLabels.Visible = true;
X = "Month";
Y = "Patient No.";
chart.DataXValueField = X;
chart.DataYValueField = Y;
foreach (DataRow dr2 in dt.Rows)
{
chart.Data.Add(new ChartPoint(dr2["Month"].ToString(),
(int)System.Convert.ToSingle(dr2["Qnty"])));
}
ConfigureColors();
ChartControl1.Charts.Clear();
ChartControl1.Charts.Add(chart);
ChartControl1.HasChartLegend = true;
chart.ShowLegend = false;
ChartControl1.RedrawChart();
}
catch (Exception ex)
{
Response.Write(ex.Message);
}
}
References
Conclusion
Carlos' WebChart control is an easy-to-use, free component for creating a variety of common graphs.
Adding WebCharts to a project takes just a few minutes of time and a handful of lines of code.
While WebCharts is easy to get using, it is limited to fairly simple graphing scenarios and creating aesthetically pleasing charts can
take a bit of trial and error in adjusting assorted WebCharts properties.
But if all you need are a few simple charts for your Web application, WebCharts will be the tools you are looking for.
Conclusion
Please check out my FusionChartGraph example where I will show you how to create some breathtaking
graph generation.
History
- 13th September, 2012: Initial version

